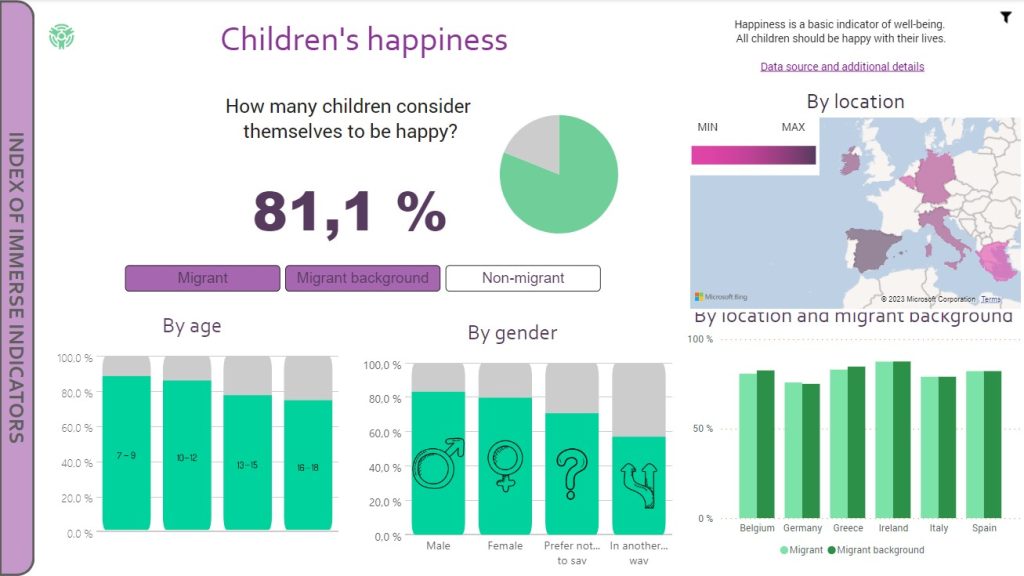
One of the concerns of the IMMERSE project from the beginning was how to make the project results accessible and useful for all the stakeholders. Reaching the final stretch, the project partners are proud to launch one of the most remarkable appliances: the Dashboard of Socio-Educational Integration Indicators.
The IMMERSE indicators, comprising 30 integration metrics, serve to standardize data collection for studying factors influencing the socio-educational integration of migrant and refugee children across Europe. These indicators are derived from a comprehensive analysis of primary data (collected from 2021-2023, involving 24,419 children and 406 sites) and secondary sources (Eurostat, national ministries, statistical offices, MIPEX, PISA, Eurydice).
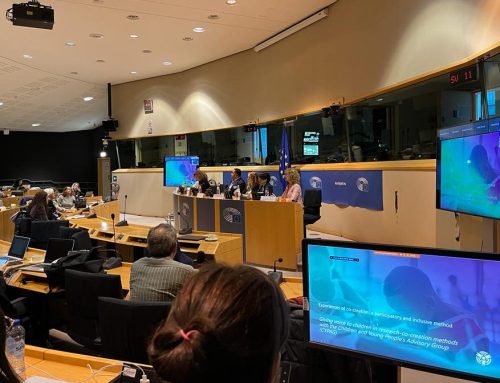
The Dashboard of Indicators is a data visualization tool that allows running basic visual analysis at different levels of disaggregation with the IMMERSE 30 indicators, and it is publicly accessible through the IMMERSE website at https://www.immerse-h2020.eu/dashboard-of-socio-educational-integration-indicators/ The Dashboard has been developed using a co-creation method which includes the voices of migrant and refugee children, their families and those who work directly with them in schools, NGOs, and policy makers.
In the visualization tool, every indicator is accompanied by a description and a corresponding performance score. This score is dynamic and will adjust based on the various filter options selected within the tool. It allows the user to visually highlights key features regarding refugee and migrant children’s integration in a comparative perspective.
Check out tool management in the following video:


